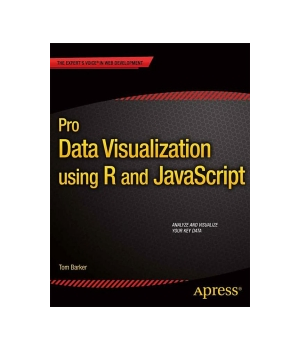
Pro Data Visualization using R and JavaScript
| Price | $49.99 - $55.29
|
| Rating | |
| Author | Tom Barker |
| Publisher | Apress |
| Published | 2013 |
| Pages | 216 |
| Language | English |
| Format | Paper book / ebook (PDF) |
| ISBN-10 | 1430258063 |
| ISBN-13 | 9781430258063 |
Pro Data Visualization using R and JavaScript makes the R language approachable, and promotes the idea of data gathering and analysis. You'll see how to use R to interrogate and analyze your data, and then use the D3 JavaScript library to format and display that data in an elegant, informative, and interactive way. You will learn how to gather data effectively, and also how to understand the philosophy and implementation of each type of chart, so as to be able to represent the results visually.
Developers at all levels interested in data visualization, beginning to intermediate engineering managers, statisticians, mathematicians, economists and any others interested in data visualization.

- Tom Barker (4 books)
4 5 4
Similar Books
Pro Data Visualization Using R and JavaScript, 2nd Edition
by Tom Barker, Jon Westfall
Use R 4, RStudio, Tidyverse, and Shiny to interrogate and analyze your data, and then use the D3 JavaScript library to format and display that data in an elegant, informative, and interactive way. You will learn how to gather data effectively, and also how to understand the philosophy and implementation of each type of chart, so as to be ...
Price: $46.21 | Publisher: Apress | Release: 2022
by Robert I. Kabacoff
R in Action, 3rd Edition makes learning R quick and easy. That's why thousands of data scientists have chosen this guide to help them master the powerful language. Far from being a dry academic tome, every example you'll encounter in this book is relevant to scientific and business developers, and helps you solve common data cha...
Price: $59.83 | Publisher: Manning | Release: 2022
Python Data Visualization Cookbook ![]()
![]()
![]()
![]()
![]()
by Igor Milovanovic
Today, data visualization is a hot topic as a direct result of the vast amount of data created every second. Transforming that data into information is a complex task for data visualization professionals, who, at the same time, try to understand the data and objectively transfer that understanding to others. This book is a set of practica...
Price: $23.99 | Publisher: Packt Publishing | Release: 2013
Hands-On Geospatial Analysis with R and QGIS ![]()
![]()
![]()
![]()
![]()
by Shammunul Islam
Managing spatial data has always been challenging and it's getting more complex as the size of data increases. Spatial data is actually big data and you need different tools and techniques to work your way around to model and create different workflows. R and QGIS have powerful features that can make this job easier.This book is your...
Price: $43.86 | Publisher: Packt Publishing | Release: 2018
Big Data Analytics with R and Hadoop ![]()
![]()
![]()
![]()
![]()
by Vignesh Prajapati
Big data analytics is the process of examining large amounts of data of a variety of types to uncover hidden patterns, unknown correlations, and other useful information. Such information can provide competitive advantages over rival organizations and result in business benefits, such as more effective marketing and increased revenue. New...
Price: $5.77 | Publisher: Packt Publishing | Release: 2013
Exam Ref 70-778 Analyzing and Visualizing Data by Using Microsoft Power BI ![]()
![]()
![]()
![]()
![]()
by Daniil Maslyuk
Prepare for Microsoft Exam 70-778 - and help demonstrate your real-world mastery of Power BI data analysis and visualization. Designed for experienced BI professionals and data analysts ready to advance their status, Exam Ref focuses on the critical thinking and decision-making acumen needed for success at the MCSA level. Focus on the exp...
Price: $31.30 | Publisher: Microsoft Press | Release: 2018
Data Visualization: a successful design process ![]()
![]()
![]()
![]()
![]()
by Andy Kirk
Do you want to create more attractive charts? Or do you have huge data sets and need to unearth the key insights in a visual manner? Data visualization is the representation and presentation of data, using proven design techniques to bring alive the patterns, stories and key insights locked away. Data Visualization: a Successful Design Pr...
Price: $17.99 | Publisher: Packt Publishing | Release: 2012
Data Visualization with Python and JavaScript, 2nd Edition ![]()
![]()
![]()
![]()
![]()
by Kyran Dale
How do you turn raw, unprocessed, or malformed data into dynamic, interactive web visualizations? In this practical book, author Kyran Dale shows data scientists and analysts-as well as Python and JavaScript developers-how to create the ideal toolchain for the job. By providing engaging examples and stressing hard-earned best practices, t...
Price: $60.99 | Publisher: O'Reilly Media | Release: 2022

