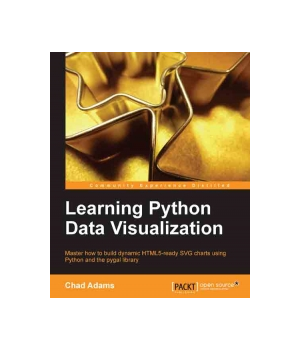
Learning Python Data Visualization
Master how to build dynamic HTML5-ready SVG charts using Python and the pygal library
| Price | $47.99
|
| Rating | |
| Author | Chad R. Adams |
| Publisher | Packt Publishing |
| Published | 2014 |
| Pages | 212 |
| Language | English |
| Format | Paper book / ebook (PDF) |
| ISBN-10 | 1783553332 |
| ISBN-13 | 9781783553334 |
The best applications use data and present it in a meaningful, easy-to-understand way. Packed with sample code and tutorials, this book will walk you through installing common charts, graphics, and utility libraries for the Python programming language.
Firstly you will discover how to install and reference libraries in Visual Studio or Eclipse. We will then go on to build simple graphics and charts that allow you to generate HTML5-ready SVG charts and graphs, along with testing and validating your data sources. We will also cover parsing data from the Web and offline sources, and building a Python charting application using dynamic data. Lastly, we will review other popular tools and frameworks used to create charts and import/export chart data. By the end of this book, you will be able to represent complex sets of data using Python.

- Chad R. Adams (2 books)
3 5 5
Similar Books
Python Data Visualization Cookbook, 2nd Edition ![]()
![]()
![]()
![]()
![]()
by Igor Milovanovic, Dimitry Foures, Giuseppe Vettigli
Python Data Visualization Cookbook will progress the reader from the point of installing and setting up a Python environment for data manipulation and visualization all the way to 3D animations using Python libraries. Readers will benefit from over 60 precise and reproducible recipes that will guide the reader towards a better understandi...
Price: $44.99 | Publisher: Packt Publishing | Release: 2015
Python Data Visualization Cookbook ![]()
![]()
![]()
![]()
![]()
by Igor Milovanovic
Today, data visualization is a hot topic as a direct result of the vast amount of data created every second. Transforming that data into information is a complex task for data visualization professionals, who, at the same time, try to understand the data and objectively transfer that understanding to others. This book is a set of practica...
Price: $23.99 | Publisher: Packt Publishing | Release: 2013
Learning QlikView Data Visualization ![]()
![]()
![]()
![]()
![]()
by Karl Pover
While QlikView's data engine complements our thought processes and gives us the ability to rapidly implement insightful data discovery, we must also learn to use proper analytical and data visualization techniques to enhance our ability to make data more presentable.Learning QlikView Data Visualization presents a simple way to organi...
Price: $22.99 | Publisher: Packt Publishing | Release: 2013
Learning IPython for Interactive Computing and Data Visualization ![]()
![]()
![]()
![]()
![]()
by Cyrille Rossant
You already use Python as a scripting language, but did you know it is also increasingly used for scientific computing and data analysis? Interactive programming is essential in such exploratory tasks and IPython is the perfect tool for that. Once you've learnt it, you won't be able to live without it.Learning IPython for Intera...
Price: $14.81 | Publisher: Packt Publishing | Release: 2013
Mastering Python Data Visualization ![]()
![]()
![]()
![]()
![]()
by Kirthi Raman
Python has a handful of open source libraries for numerical computations involving optimization, linear algebra, integration, interpolation, and other special functions using array objects, machine learning, data mining, and plotting. Pandas have a productive environment for data analysis. These libraries have a specific purpose and play ...
Price: $54.38 | Publisher: Packt Publishing | Release: 2015
Learning iCloud Data Management ![]()
![]()
![]()
![]()
![]()
by Jesse Feiler
As apps rapidly move into business and the cloud, iOS and OS X developers need new data management techniques. In Learning iCloud Data Management, renowned Apple database expert Jesse Feiler shows you how to use Apple's latest APIs and technologies to structure and synchronize all forms of data. Feiler helps you understand the issues...
Price: $24.07 | Publisher: Addison-Wesley | Release: 2014
by Ivan Idris
Data analysis is a rapidly evolving field and Python is a multi-paradigm programming language suitable for object-oriented application development and functional design patterns. As Python offers a range of tools and libraries for all purposes, it has slowly evolved as the primary language for data science, including topics on: data analy...
Price: $34.99 | Publisher: Packt Publishing | Release: 2016
by Jack Dougherty, Ilya Ilyankou
Tell your story and show it with data, using free and easy-to-learn tools on the web. This introductory book teaches you how to design interactive charts and customized maps for your website, beginning with simple drag-and-drop tools such as Google Sheets, Datawrapper, and Tableau Public. You'll also gradually learn how to edit open ...
Price: $44.99 | Publisher: O'Reilly Media | Release: 2021

