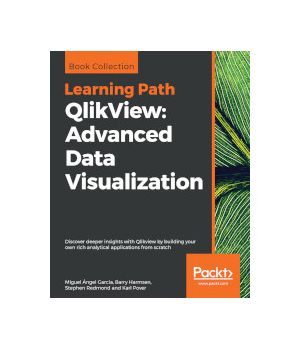
QlikView: Advanced Data Visualization
Discover Deeper Insights with Qlikview by Building Your Own Rich Analytical Applications from Scratch
| Price | $49.99 - $62.45
|
| Rating | |
| Authors | Miguel Angel Garcia, Barry Harmsen, Stephen Redmond |
| Publisher | Packt Publishing |
| Published | 2018 |
| Pages | 786 |
| Language | English |
| Format | Paper book / ebook (PDF) |
| ISBN-10 | 1789955998 |
| ISBN-13 | 9781789955996 |
QlikView is one of the most flexible and powerful business intelligence platforms around, and if you want to transform data into insights, it is one of the best options you have at hand. Use this Learning Path, to explore the many features of QlikView to realize the potential of your data and present it as impactful and engaging visualizations.
Each chapter in this Learning Path starts with an understanding of a business requirement and its associated data model and then helps you create insightful analysis and data visualizations around it. You will look at problems that you might encounter while visualizing complex data insights using QlikView, and learn how to troubleshoot these and other not-so-common errors. This Learning Path contains real-world examples from a variety of business domains, such as sales, finance, marketing, and human resources.

- Miguel Angel Garcia
- Barry Harmsen (2 books)
- Stephen Redmond (4 books)
5 5 1
Similar Books
Python Data Visualization Cookbook, 2nd Edition ![]()
![]()
![]()
![]()
![]()
by Igor Milovanovic, Dimitry Foures, Giuseppe Vettigli
Python Data Visualization Cookbook will progress the reader from the point of installing and setting up a Python environment for data manipulation and visualization all the way to 3D animations using Python libraries. Readers will benefit from over 60 precise and reproducible recipes that will guide the reader towards a better understandi...
Price: $44.99 | Publisher: Packt Publishing | Release: 2015
by Jack Dougherty, Ilya Ilyankou
Tell your story and show it with data, using free and easy-to-learn tools on the web. This introductory book teaches you how to design interactive charts and customized maps for your website, beginning with simple drag-and-drop tools such as Google Sheets, Datawrapper, and Tableau Public. You'll also gradually learn how to edit open ...
Price: $44.99 | Publisher: O'Reilly Media | Release: 2021
Learning IPython for Interactive Computing and Data Visualization ![]()
![]()
![]()
![]()
![]()
by Cyrille Rossant
You already use Python as a scripting language, but did you know it is also increasingly used for scientific computing and data analysis? Interactive programming is essential in such exploratory tasks and IPython is the perfect tool for that. Once you've learnt it, you won't be able to live without it.Learning IPython for Intera...
Price: $14.81 | Publisher: Packt Publishing | Release: 2013
Data Visualization: a successful design process ![]()
![]()
![]()
![]()
![]()
by Andy Kirk
Do you want to create more attractive charts? Or do you have huge data sets and need to unearth the key insights in a visual manner? Data visualization is the representation and presentation of data, using proven design techniques to bring alive the patterns, stories and key insights locked away. Data Visualization: a Successful Design Pr...
Price: $17.99 | Publisher: Packt Publishing | Release: 2012
Learning QlikView Data Visualization ![]()
![]()
![]()
![]()
![]()
by Karl Pover
While QlikView's data engine complements our thought processes and gives us the ability to rapidly implement insightful data discovery, we must also learn to use proper analytical and data visualization techniques to enhance our ability to make data more presentable.Learning QlikView Data Visualization presents a simple way to organi...
Price: $22.99 | Publisher: Packt Publishing | Release: 2013
by Nora Mulvaney, Audrey Wubbenhorst, Amtoj Kaur
A short course for students to increase their proficiency in analyzing and interpreting data visualizations. By completing this short course students will be able to explain the importance of data literacy, identify data visualization issues in order to improve their own skills in data story-telling. The intended outcome of this course is...
Free ebook | Publisher: Self-publishing | Release: 2022
Python Data Visualization Cookbook ![]()
![]()
![]()
![]()
![]()
by Igor Milovanovic
Today, data visualization is a hot topic as a direct result of the vast amount of data created every second. Transforming that data into information is a complex task for data visualization professionals, who, at the same time, try to understand the data and objectively transfer that understanding to others. This book is a set of practica...
Price: $23.99 | Publisher: Packt Publishing | Release: 2013
Communicating Data with Tableau ![]()
![]()
![]()
![]()
![]()
by Ben Jones
Go beyond spreadsheets and tables and design a data presentation that really makes an impact. This practical guide shows you how to use Tableau Software to convert raw data into compelling data visualizations that provide insight or allow viewers to explore the data for themselves.Ideal for analysts, engineers, marketers, journalists, and...
Price: $31.99 | Publisher: O'Reilly Media | Release: 2014

