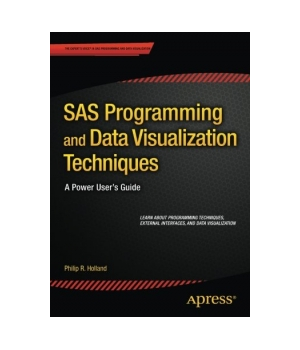
SAS Programming and Data Visualization Techniques
A Power User's Guide
| Price | $44.99 - $50.87
|
| Rating | |
| Author | Philip R. Holland |
| Publisher | Apress |
| Published | 2015 |
| Pages | 272 |
| Language | English |
| Format | Paper book / ebook (PDF) |
| ISBN-10 | 1484205693 |
| ISBN-13 | 9781484205693 |
SAS Programming and Data Visualization Techniques: A Power User's Guide brings together a wealth of ideas about strategic and tactical solutions to everyday situations experienced when transferring, extracting, processing, analyzing, and reporting the valuable data you have at your fingertips. Best, you can achieve most of the solutions using the SAS components you already license, meaning that this book's insights can keep you from throwing money at problems needlessly.
Author Philip R. Holland advises a broad range of clients throughout Europe and the United States as an independent consultant and founder of Holland Numerics Ltd, a SAS technical consultancy. In this book he explains techniques - through code samples and example - that will enable you to increase your knowledge of all aspects of SAS programming, improve your coding productivity, and interface SAS with other programs.

- Philip R. Holland
4 5 4
Similar Books
Learning IPython for Interactive Computing and Data Visualization ![]()
![]()
![]()
![]()
![]()
by Cyrille Rossant
You already use Python as a scripting language, but did you know it is also increasingly used for scientific computing and data analysis? Interactive programming is essential in such exploratory tasks and IPython is the perfect tool for that. Once you've learnt it, you won't be able to live without it.Learning IPython for Intera...
Price: $14.81 | Publisher: Packt Publishing | Release: 2013
Advanced R Statistical Programming and Data Models
by Matt Wiley, Joshua F. Wiley
Carry out a variety of advanced statistical analyses including generalized additive models, mixed effects models, multiple imputation, machine learning, and missing data techniques using R. Each chapter starts with conceptual background information about the techniques, includes multiple examples using R to achieve results, and concludes ...
Price: $49.99 | Publisher: Apress | Release: 2019
Learning QlikView Data Visualization ![]()
![]()
![]()
![]()
![]()
by Karl Pover
While QlikView's data engine complements our thought processes and gives us the ability to rapidly implement insightful data discovery, we must also learn to use proper analytical and data visualization techniques to enhance our ability to make data more presentable.Learning QlikView Data Visualization presents a simple way to organi...
Price: $22.99 | Publisher: Packt Publishing | Release: 2013
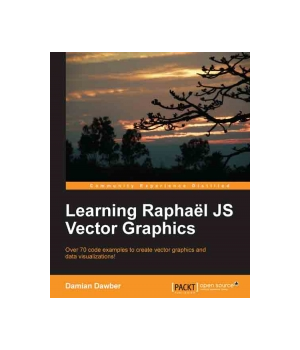
Learning Raphael JS Vector Graphics ![]()
![]()
![]()
![]()
![]()
by Damian Dawber
Raphael is an exceptional library that makes drawing vector graphics in the browser straightforward. It boasts a large number of methods that facilitate drawing and animating graphics, allowing developers to create flexible, interactive web applications and data visualizations.Learning Raphael JS Vector Graphics takes you from being a com...
Price: $14.99 | Publisher: Packt Publishing | Release: 2013
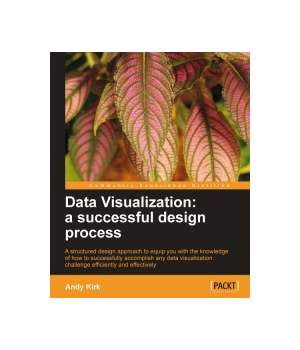
Data Visualization: a successful design process ![]()
![]()
![]()
![]()
![]()
by Andy Kirk
Do you want to create more attractive charts? Or do you have huge data sets and need to unearth the key insights in a visual manner? Data visualization is the representation and presentation of data, using proven design techniques to bring alive the patterns, stories and key insights locked away. Data Visualization: a Successful Design Pr...
Price: $17.99 | Publisher: Packt Publishing | Release: 2012
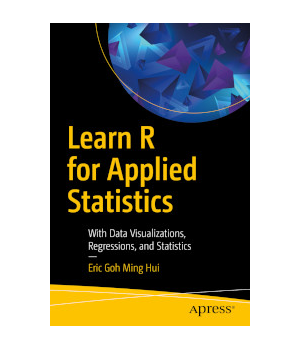
Learn R for Applied Statistics ![]()
![]()
![]()
![]()
![]()
by Goh Hui
Gain the R programming language fundamentals for doing the applied statistics useful for data exploration and analysis in data science and data mining. This book covers topics ranging from R syntax basics, descriptive statistics, and data visualizations to inferential statistics and regressions. After learning R's syntax, you will wo...
Price: $29.23 | Publisher: Apress | Release: 2019
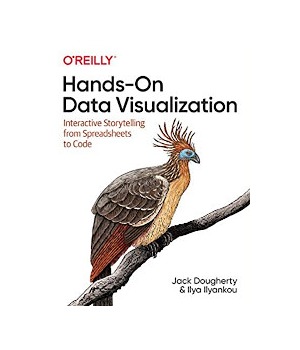
by Jack Dougherty, Ilya Ilyankou
Tell your story and show it with data, using free and easy-to-learn tools on the web. This introductory book teaches you how to design interactive charts and customized maps for your website, beginning with simple drag-and-drop tools such as Google Sheets, Datawrapper, and Tableau Public. You'll also gradually learn how to edit open ...
Price: $44.99 | Publisher: O'Reilly Media | Release: 2021
Python Data Visualization Cookbook, 2nd Edition ![]()
![]()
![]()
![]()
![]()
by Igor Milovanovic, Dimitry Foures, Giuseppe Vettigli
Python Data Visualization Cookbook will progress the reader from the point of installing and setting up a Python environment for data manipulation and visualization all the way to 3D animations using Python libraries. Readers will benefit from over 60 precise and reproducible recipes that will guide the reader towards a better understandi...
Price: $44.99 | Publisher: Packt Publishing | Release: 2015

