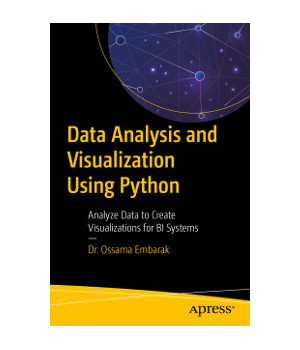
Data Analysis and Visualization Using Python
Analyze Data to Create Visualizations for BI Systems
| Price | $22.63 - $29.60
|
| Rating | |
| Author | Dr. Ossama Embarak |
| Publisher | Apress |
| Published | 2018 |
| Pages | 374 |
| Language | English |
| Format | Paper book / ebook (PDF) |
| ISBN-10 | 1484241088 |
| ISBN-13 | 9781484241080 |
Look at Python from a data science point of view and learn proven techniques for data visualization as used in making critical business decisions. Starting with an introduction to data science with Python, you will take a closer look at the Python environment and get acquainted with editors such as Jupyter Notebook and Spyder. After going through a primer on Python programming, you will grasp fundamental Python programming techniques used in data science. Moving on to data visualization, you will see how it caters to modern business needs and forms a key factor in decision-making. You will also take a look at some popular data visualization libraries in Python.
Shifting focus to data structures, you will learn the various aspects of data structures from a data science perspective. You will then work with file I/O and regular expressions in Python, followed by gathering and cleaning data. Moving on to exploring and analyzing data, you will look at advanced data structures in Python. Then, you will take a deep dive into data visualization techniques, going through a number of plotting systems in Python.
In conclusion, you will complete a detailed case study, where you'll get a chance to revisit the concepts you've covered so far.
Use Python programming techniques for data science; Master data collections in Python; Create engaging visualizations for BI systems; Deploy effective strategies for gathering and cleaning data; Integrate the Seaborn and Matplotlib plotting systems.

- Dr. Ossama Embarak
Similar Books
Microsoft Excel 2019 Data Analysis and Business Modeling, 6th Edition ![]()
![]()
![]()
![]()
![]()
by Wayne Winston
Master business modeling and analysis techniques with Microsoft Excel 2019 and Office 365 and transform data into bottom-line results. Written by award-winning educator Wayne Winston, this hands-on, scenario-focused guide helps you use Excel to ask the right questions and get accurate, actionable answers. New coverage ranges from Power Qu...
Price: $23.99 | Publisher: Microsoft Press | Release: 2019
Hands-On Data Structures and Algorithms with Python, 3rd Edition ![]()
![]()
![]()
![]()
![]()
by Dr. Basant Agarwal
Choosing the right data structure is pivotal to optimizing the performance and scalability of applications. This new edition of Hands-On Data Structures and Algorithms with Python will expand your understanding of key structures, including stacks, queues, and lists, and also show you how to apply priority queues and heaps in applications....
Price: $35.99 | Publisher: Packt Publishing | Release: 2022
by Alan Fontaine
Python is one of the most common and popular languages preferred by leading data analysts and statisticians for working with massive datasets and complex data visualizations.Become a Python Data Analyst introduces Python's most essential tools and libraries necessary to work with the data analysis process, right from preparing data t...
Price: $23.99 | Publisher: Packt Publishing | Release: 2018
by Silas Toms, Bill Parker
Integrating Python into your day-to-day ArcGIS work is highly recommended when dealing with large amounts of geospatial data. Python for ArcGIS Pro aims to help you get your work done faster, with greater repeatability and higher confidence in your results.Starting from programming basics and building in complexity, two experienced ArcGIS...
Price: $37.49 | Publisher: Packt Publishing | Release: 2022
Python Data Visualization Cookbook ![]()
![]()
![]()
![]()
![]()
by Igor Milovanovic
Today, data visualization is a hot topic as a direct result of the vast amount of data created every second. Transforming that data into information is a complex task for data visualization professionals, who, at the same time, try to understand the data and objectively transfer that understanding to others. This book is a set of practica...
Price: $23.99 | Publisher: Packt Publishing | Release: 2013
Network Graph Analysis and Visualization with Gephi ![]()
![]()
![]()
![]()
![]()
by Ken Cherven
Gephi is an interactive visualization and exploration platform for all kinds of networks and complex systems. Social media data has helped to drive network visualization to new levels of relevance and importance. However, there is far more to network visualization than just social media data. For analyzing and visualizing network graphs, ...
Price: $19.99 | Publisher: Packt Publishing | Release: 2013
by Ivan Idris
Dive deeper into data analysis with the flexibility of Python and learn how its extensive range of scientific and mathematical libraries can be used to solve some of the toughest challenges in data analysis. Build your confidence and expertise and develop valuable skills in high demand in a world driven by Big Data with this expert data a...
Price: $49.99 | Publisher: Packt Publishing | Release: 2014
Graph Analysis and Visualization ![]()
![]()
![]()
![]()
![]()
by Richard Brath, David Jonker
Graph Analysis and Visualization brings graph theory out of the lab and into the real world. Using sophisticated methods and tools that span analysis functions, this guide shows you how to exploit graph and network analytic techniques to enable the discovery of new business insights and opportunities. Published in full color, the book des...
Price: $44.01 | Publisher: Wiley | Release: 2015

