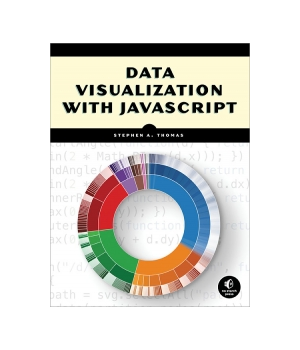
Data Visualization with JavaScript
| Price | $10.97 - $22.33
|
| Rating | |
| Author | Stephen A. Thomas |
| Publisher | No Starch Press |
| Published | 2015 |
| Pages | 384 |
| Language | English |
| Format | Paper book / ebook (PDF) |
| ISBN-10 | 1593276052 |
| ISBN-13 | 9781593276058 |
You've got data to communicate. But what kind of visualization do you choose, how do you build it, and how do you ensure that it's up to the demands of the Web?
In Data Visualization with JavaScript, you'll learn how to use JavaScript, HTML, and CSS to build the most practical visualizations for your data. Step-by-step examples walk you through creating, integrating, and debugging different types of visualizations and will have you building basic visualizations, like bar, line, and scatter graphs, in no time.
If you already know your way around building a web page but aren't quite sure how to build a good visualization, Data Visualization with JavaScript will help you get your feet wet without throwing you into the deep end. Before you know it, you'll be well on your way to creating simple, powerful data visualizations.
Chapter 7:
→ https://itbook.store/files/9781593276058/chapter7.pdf
Source Code:
→ https://itbook.store/files/9781593276058/sourcecode.zip

- Stephen A. Thomas
4 5 25
Similar Books
by Elijah Meeks
Visualizing complex data is hard. Visualizing complex data on the web is darn near impossible without D3.js. D3 is a JavaScript library that provides a simple but powerful data visualization API over HTML, CSS, and SVG. Start with a structure, dataset, or algorithm; mix in D3; and you can programmatically generate static, animated, or int...
Price: $15.63 | Publisher: Manning | Release: 2017
Data Wrangling with JavaScript ![]()
![]()
![]()
![]()
![]()
by Ashley Davis
Data Wrangling with JavaScript is hands-on guide that will teach you how to create a JavaScript-based data processing pipeline, handle common and exotic data, and master practical troubleshooting strategies.Why not handle your data analysis in JavaScript? Modern libraries and data handling techniques mean you can collect, clean, process, ...
Price: $41.15 | Publisher: Manning | Release: 2018
High Impact Data Visualization with Power View, Power Map, and Power BI ![]()
![]()
![]()
![]()
![]()
by Adam Aspin
High Impact Data Visualization with Power View, Power Map, and Power BI helps you take business intelligence delivery to a new level that is interactive, engaging, even fun, all while driving commercial success through sound decision-making. Learn to harness the power of Microsoft's flagship, self-service business intelligence suite ...
Price: $25.43 | Publisher: Apress | Release: 2014
Data Visualization with Python and JavaScript, 2nd Edition ![]()
![]()
![]()
![]()
![]()
by Kyran Dale
How do you turn raw, unprocessed, or malformed data into dynamic, interactive web visualizations? In this practical book, author Kyran Dale shows data scientists and analysts-as well as Python and JavaScript developers-how to create the ideal toolchain for the job. By providing engaging examples and stressing hard-earned best practices, t...
Price: $60.99 | Publisher: O'Reilly Media | Release: 2022
Communicating Data with Tableau ![]()
![]()
![]()
![]()
![]()
by Ben Jones
Go beyond spreadsheets and tables and design a data presentation that really makes an impact. This practical guide shows you how to use Tableau Software to convert raw data into compelling data visualizations that provide insight or allow viewers to explore the data for themselves.Ideal for analysts, engineers, marketers, journalists, and...
Price: $31.99 | Publisher: O'Reilly Media | Release: 2014
Agile Visualization with Pharo ![]()
![]()
![]()
![]()
![]()
by Alexandre Bergel
Use the Pharo interactive development environment to significantly reduce the cost of creating interactive visualizations. This book shows how Pharo leverages visualization development against traditional frameworks and toolkits.Agile Visualization with Pharo focuses on the Roassal visualization engine and first presents the basic and nec...
Price: $28.61 | Publisher: Apress | Release: 2022
by Jack Dougherty, Ilya Ilyankou
Tell your story and show it with data, using free and easy-to-learn tools on the web. This introductory book teaches you how to design interactive charts and customized maps for your website, beginning with simple drag-and-drop tools such as Google Sheets, Datawrapper, and Tableau Public. You'll also gradually learn how to edit open ...
Price: $44.99 | Publisher: O'Reilly Media | Release: 2021
Practical Data Science with R, 2nd Edition ![]()
![]()
![]()
![]()
![]()
by Nina Zumel, John Mount
Practical Data Science with R, Second Edition takes a practice-oriented approach to explaining basic principles in the ever expanding field of data science. You'll jump right to real-world use cases as you apply the R programming language and statistical analysis techniques to carefully explained examples based in marketing, business...
Price: $39.99 | Publisher: Manning | Release: 2019

