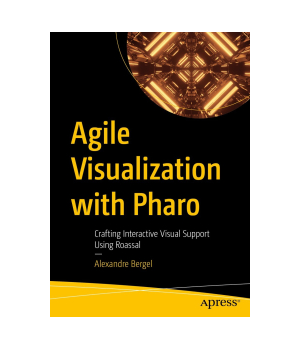
Agile Visualization with Pharo
Crafting Interactive Visual Support Using Roassal
| Price | $28.61 - $31.18
|
| Rating | |
| Author | Alexandre Bergel |
| Publisher | Apress |
| Published | 2022 |
| Pages | 266 |
| Language | English |
| Format | Paper book / ebook (PDF) |
| ISBN-10 | 1484271602 |
| ISBN-13 | 9781484271605 |
Use the Pharo interactive development environment to significantly reduce the cost of creating interactive visualizations. This book shows how Pharo leverages visualization development against traditional frameworks and toolkits.
Agile Visualization with Pharo focuses on the Roassal visualization engine and first presents the basic and necessary tools to visualize data, including an introduction to the Pharo programming language. Once you've grasped the basics, you'll learn all about the development environment offered by Roassal. The book provides numerous ready-to-use examples. You'll work on several applications, including visualizing the training phase of reinforcement learning (a powerful machine learning algorithm) and generating software visualizations from GitHub.

- Alexandre Bergel
3 5 2
Similar Books
Network Graph Analysis and Visualization with Gephi ![]()
![]()
![]()
![]()
![]()
by Ken Cherven
Gephi is an interactive visualization and exploration platform for all kinds of networks and complex systems. Social media data has helped to drive network visualization to new levels of relevance and importance. However, there is far more to network visualization than just social media data. For analyzing and visualizing network graphs, ...
Price: $19.99 | Publisher: Packt Publishing | Release: 2013
High Impact Data Visualization with Power View, Power Map, and Power BI ![]()
![]()
![]()
![]()
![]()
by Adam Aspin
High Impact Data Visualization with Power View, Power Map, and Power BI helps you take business intelligence delivery to a new level that is interactive, engaging, even fun, all while driving commercial success through sound decision-making. Learn to harness the power of Microsoft's flagship, self-service business intelligence suite ...
Price: $25.43 | Publisher: Apress | Release: 2014
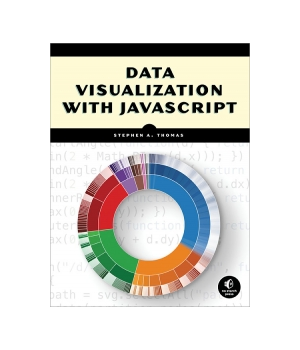
Data Visualization with JavaScript ![]()
![]()
![]()
![]()
![]()
by Stephen A. Thomas
You've got data to communicate. But what kind of visualization do you choose, how do you build it, and how do you ensure that it's up to the demands of the Web?In Data Visualization with JavaScript, you'll learn how to use JavaScript, HTML, and CSS to build the most practical visualizations for your data. Step-by-step examp...
Price: $10.97 | Publisher: No Starch Press | Release: 2015
by Elijah Meeks
Visualizing complex data is hard. Visualizing complex data on the web is darn near impossible without D3.js. D3 is a JavaScript library that provides a simple but powerful data visualization API over HTML, CSS, and SVG. Start with a structure, dataset, or algorithm; mix in D3; and you can programmatically generate static, animated, or int...
Price: $15.63 | Publisher: Manning | Release: 2017
Agile Software Engineering with Visual Studio, 2nd Edition ![]()
![]()
![]()
![]()
![]()
by Sam Guckenheimer, Neno Loje
Using agile methods and the tools of Visual Studio 2010, development teams can deliver higher-value software faster, systematically eliminate waste, and increase transparency throughout the entire development lifecycle. Now, Microsoft Visual Studio product owner Sam Guckenheimer and leading Visual Studio implementation consultant Neno Loj...
Price: $4.15 | Publisher: Addison-Wesley | Release: 2011
Integrating CMMI and Agile Development ![]()
![]()
![]()
![]()
![]()
by Paul E. McMahon
Many organizations that have improved process maturity through Capability Maturity Model Integration (CMMI) now also want greater agility. Conversely, many organizations that are succeeding with Agile methods now want the benefits of more mature processes. The solution is to integrate CMMI and Agile. Integrating CMMI and Agile Development...
Price: $23.94 | Publisher: Addison-Wesley | Release: 2010
Data Visualization with Python and JavaScript, 2nd Edition ![]()
![]()
![]()
![]()
![]()
by Kyran Dale
How do you turn raw, unprocessed, or malformed data into dynamic, interactive web visualizations? In this practical book, author Kyran Dale shows data scientists and analysts-as well as Python and JavaScript developers-how to create the ideal toolchain for the job. By providing engaging examples and stressing hard-earned best practices, t...
Price: $60.99 | Publisher: O'Reilly Media | Release: 2022
by Mike Dewar
Learn how to create beautiful, interactive, browser-based data visualizations with the D3 JavaScript library. This hands-on book shows you how to use a combination of JavaScript and SVG to build everything from simple bar charts to complex infographics. You'll learn how to use basic D3 tools by building visualizations based on real d...
Price: $12.99 | Publisher: O'Reilly Media | Release: 2012

